This fact sheet discusses how the U.S. government measures poverty, why the current measure is inadequate, and what alternative ways exist to measure economic hardship.
How does the U.S. measure poverty?
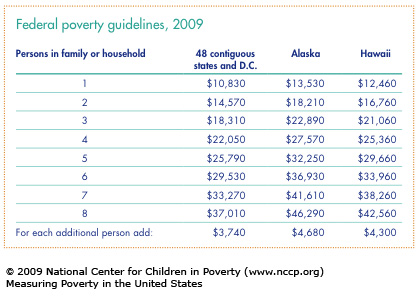
The U.S. government measures poverty by a narrow income standard that does not include other aspects of economic status, such as material hardship (for example, living in substandard housing) or debt, nor does it consider financial assets (including savings or property). The official poverty measure is a specific dollar amount that varies by family size but is the same across the continental U.S. According to the guidelines, the poverty level in 2009 is $22,050 a year for a family of four and $18,310 for a family of three (see table). The poverty guidelines are used to determine eligibility for public programs. A similar but more complex measure is used for calculating poverty rates.
The current poverty measure was established in the 1960s and is now widely acknowledged to be flawed. It was based on research indicating that families spent about one-third of their incomes on food – the official poverty level was set by multiplying food costs by three. Since then, the figures have been updated annually for inflation but have otherwise remained unchanged.
Why is the current poverty measure inadequate?
The current poverty measure is flawed in two ways.
The current poverty level – that is, the specific dollar amount – is based on outdated assumptions about family expenditures.
Food now comprises only one-seventh of an average family’s expenses, while the costs of housing, child care, health care, and transportation have grown disproportionately. Thus, the poverty level does not reflect the true cost of supporting a family. In addition, the current poverty measure is a national standard that does not adjust for the substantial variation in the cost of living from state to state and between urban and rural areas.
More accurate estimates of typical family expenses, and adjustments for local costs, would produce substantially higher dollar amounts.
The method used to determine whether a family is poor does not accurately count family resources.
When determining if a family is poor, income sources counted include earnings, interest, dividends, Social Security, and cash assistance. But income is counted before subtracting payroll, income, and other taxes, overstating income for some families. On the other hand, the federal Earned Income Tax Credit isn’t counted either, underestimating income for other families. Also, in-kind government benefits that assist low-income families – food stamps, Medicaid, and housing and child care assistance – are not taken into account. This means that official poverty statistics cannot be used to analyze the effectiveness of these programs.
Are there alternative ways to measure poverty?
Considerable research has been conducted on better methods to measure income poverty. In the early 1990s, Congress asked the National Academy of Sciences (NAS) to investigate alternative measures. The NAS panel of experts issued a report in 1995 that recommended revising the poverty level and the method of determining which families are poor. The panel’s recommendations included the following:
- Create new poverty thresholds that more accurately reflect the cost of food, clothing, and shelter.
- Adjust thresholds by region to account for variation in the cost of living.
- When counting families’ resources to determine whether they fall below the poverty line:
- use families’ post-tax income;
- include earned income tax credits and the value of near-cash benefits (such as food stamps and housing assistance); and
- subtract the cost of work- related expenses (such as child care and transportation) and medical care.
If the NAS recommendations were adopted, millions more people would be considered officially poor. But even these recommendations underestimate the cost of family expenses and thus produce poverty thresholds well below what it takes to make ends meet, for example, increasing the poverty level for a family of four by only about $3,000 annually.
How much does it really take to make ends meet?
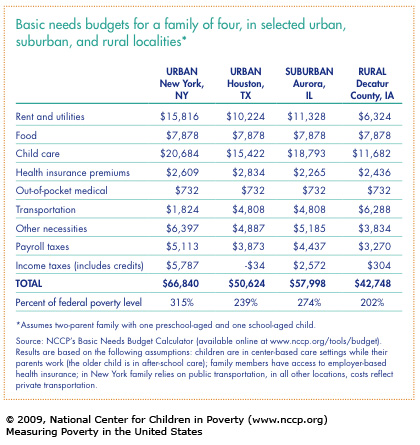
Given that the federal poverty level grossly understates how much it takes to support a family, researchers have developed budgets that realistically quantify basic living costs in specific locali- ties. Building on earlier efforts, NCCP has developed Basic Needs Budgets that include only the most basic daily living expenses and are based on modest assumptions about costs. For example, the budgets in the table at right assume that family members have employer-sponsored health coverage, even though the majority of low-wage workers do not have employer coverage. NCCP’s Basic Needs Budgets do not include money to purchase life or disability insurance or to create a rainy-day fund that would help a family withstand a job loss or other financial crisis. Nor do they allow for investments in a family’s future financial success, such as savings to buy a home or for a child’s education. In short, these budgets indicate what it takes for a family to cover their most basic living expenses – enough to get by but not enough to get ahead.
Basic Needs Budget Calculator
NCCP’s Basic Needs Budget Calculator provides access to budgets for nearly 100 localities across 14 states, with more states coming soon. Users select the number of parents and number and ages of the family’s children. Budgets assume that all families include at least one full- time worker; for two-parent families, users make choices about the employment status of the other parent. Users may also substitute their own numbers for one or more expense estimates, and the Calculator adjusts the family’s tax liability and overall budget totals accordingly.
Across the country, families typically need an income of at least twice the official poverty level to meet basic needs. In high-cost cities such as New York, it may take an income of over three times the poverty level to make ends meet, whereas in some rural areas, the figure may be under double the poverty level.
In short, even if the official poverty measure is revised along the lines suggested by the NAS, it would remain a measure of deprivation and severe hardship. In contrast, Basic Needs Budgets provide a way to think about what families need to maintain a minimally decent standard of living.
Endnotes
1. The federal poverty guidelines are used for administrative purposes, such as determining financial eligibility for benefit programs. For statistical purposes, researchers use a different – but quite similar – version of the federal poverty measure, the federal poverty thresholds, issued by the U.S. Census Bureau. Both the guidelines and the thresholds are commonly referred to as the federal poverty level (FPL).
2. Cauthen, Nancy K. 2007. Testimony on Measuring Poverty in America. Testimony before the House Subcommittee on Income Security and Family Support, Committee on Ways and Means. Aug. 1, 2007.
3. Betson, David M.; Citro, Constance F.; Michael, Robert T. 2000. Recent Developments for Poverty Measurement in U.S. Official Statistics. Journal of Official Statistics 16(2): 87-111.
4. Bernstein, Jared. 2007. More Poverty than Meets the Eye (Economic Snapshots, April 11, 2007). Washington, DC: Economic Policy Institute.
5. These efforts include Self-Sufficiency Standards developed by Diana Pearce for Wider Opportunities for Women and the Economic Policy Institute’s Basic Family Budgets.
6. Only 59 percent of all workers have access to employer-sponsored health coverage; the proportion is much lower among low-wage workers. Krugman, Paul. 2007. The Conscience of a Liberal. New York, NY: W.W. Norton& Co.
7. Dinan, Kinsey Alden. 2009. Budgeting for Basic Needs: A Struggle for Working Families. New York, NY: National Center for Children in Poverty, Columbia University, Mailman School of Public Health.
NCCP wishes to give special acknowledgement to Nancy K. Cauthen, PhD, principal author of the original iteration of this fact sheet.